
Appearance
Assessment levels and progress
What level a pupil is playing at, who decides it, and how a year of those levels becomes a measure of progress.
Where the levels are set up: Settings > Activity > Assessments
Two different senses of "progression"
This page is about pupils moving up the levels. Progression elsewhere in Xperios means something else entirely — carrying pupils into the next academic year. The dashboard and queries below use the first sense, and the two are easy to confuse when somebody asks for "the progression figures".
The teacher sets the level, having heard the pupil
A level is not chosen when a place is applied for or offered. Neither the parent nor the person in the office offering the place knows what level the pupil plays at — only the teacher does, and only once they have heard them.
So a pupil starts with no level, and the teacher sets it from the first lesson:
| Where | How |
|---|---|
| The Portal | Lesson > Attendees > Assessment |
| The teacher app | The pupil, within the lesson |
A level is recorded against a lesson and applies from that lesson onwards. What builds up is therefore a history of what the pupil was assessed at and when, rather than one current figure overwriting the last — and it is that history which makes progress measurable at all.
The value is what makes it measurable
Each level carries a value, which does two jobs: it puts the levels in order, and it says how big the step between them is.
| Values | What they say |
|---|---|
| 1, 2, 3, 4 | Equal steps — each level is as far from the last as any other |
| 1, 2, 4, 8 | Each level is harder to reach than the one before it |
A value of 0 means not a level at all — Not Known and its like. Those are left out of progress entirely, and any number of levels can sit at 0.
Check your values
On 13 November 2026 every customer's levels were given values. Where you had already set them, your order was kept. Otherwise the order was taken from the order your own pupils actually move through the levels, lesson to lesson — never from the level names, which cannot be read reliably.
That is a sound starting point, not a decision anybody made about your service. Look at Settings > Activity > Assessments and correct anything that is wrong, because every figure below is built on those numbers.
How progress is worked out
Over a period — this year so far, or last year:
| Start | The latest level the pupil had before the period began, including the level they were at on the place they progressed from. Failing that, their first level within the period |
| End | The latest level up to the end of the period |
| Progress | The end level's value, less the start level's value |
So a pupil who went from a level worth 2 to one worth 4 has progressed by 2, and one who stayed where they were has progressed by 0. Reaching back to last year's place matters: without it, every pupil carried into a new year would look as though they had started from scratch.
The Progression dashboard
Four figures across the top, then the breakdowns:
| Average Progression This Year and Last Year | How far pupils moved, on average |
| Pupils Moved Up This Year (%) and Last Year (%) | How many moved at all, rather than how far |
Both are worth reading together. A small average with a high percentage means most pupils moved a little; a larger average with a low percentage means a few moved a long way.
The charts below compare last year against the year before — two complete years, since a year still running cannot be compared fairly with a finished one — broken down by gender, ethnic group, activity group, instrument, SEND, free school meals, pupil premium, area and school year.
Small groups are put together
Any group with fewer than five pupils in it is shown as (Small groups) rather than on its own. On a breakdown like free school meals or SEND, a bar standing for two pupils would both be statistically meaningless and tell you who those pupils were.
On the Tuition dashboard
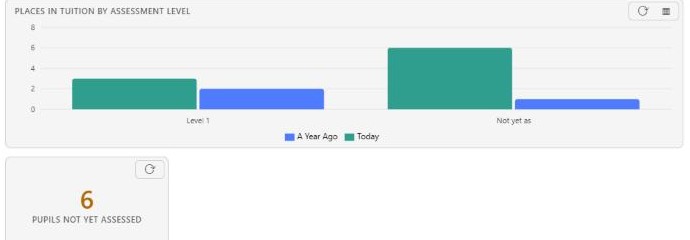
| Places in Tuition by Assessment Level | A bar for each level, by level name, with Not yet assessed last. Each level shows today against a year ago, so you can see the spread moving |
| Pupils Not Yet Assessed | How many have had a lesson and still have no level |
That second one is the one to watch. A pupil with no level is not in any progress figure at all, so a large number here quietly shrinks everything on the Progression dashboard.
Queries and reports
| KPI - Progression | Average or Moved Up %, this year or last, across thirteen breakdowns |
| Tuition - Pupil Progression | A row per pupil: start level, current level, progress, teacher and demographics |
| Tuition - Pupils Not Yet Assessed | Who has had a lesson but no level, by teacher |
| Tuition - Progression by Teacher | A report |
| Tuition - Progression by Instrument | A report |
Tuition - Pupils Not Yet Assessed being grouped by teacher is deliberate: chasing levels is a conversation with a teacher, not with a pupil.
See also
- Registers — where a teacher marks the lesson the level is set against
- Settings > Activity — setting the levels up
- Dashboards — adding these tiles to a dashboard of your own
- Progression — the other progression: carrying pupils into the next year